What 12 Industry Reports Reveal About American Booking Habits
We cross-referenced data from SiteMinder, YouGov, Criteo, the U.S. Travel Association, Pilot Plans, and six additional travel industry sources to build a composite picture of how Americans actually book vacations in 2026. The dataset covers hotel reservations, flight searches, OTA conversion patterns, and consumer surveys spanning more than 500,000 individual records across the United States.

The core finding surprised us. American travel booking behavior is no longer a bell curve centered on a comfortable window. It is polarizing into two increasingly distinct camps: meticulous advance planners who lock in getaways six months out, and spontaneous last-minute travellers who decide within days. The comfortable middle ground of reserving one to three months ahead is eroding, even as it remains the single largest segment. This article maps the evidence behind that shift, breaks down the seasonal demand curve month by month, and explores what the numbers mean for anyone planning to visit the United States this year.
US Travel Booking Trends 2026: The Numbers That Matter
- Total US spending on tourism and leisure is forecast to reach $1.37 trillion in 2026, with domestic travel accounting for 87% at $1.20 trillion (U.S. Travel Association)
- Domestic leisure spending rose 0.9% to $909 billion, a new inflation-adjusted record (U.S. Travel Association)
- The average US hotel booking window stands at 30.57 days, slightly below the global average of 32.15 days (SiteMinder 2025)
- Peak research activity occurs at 56 days before departure, with a sharp ramp-up between 90 and 180 days out (Pilot Plans 2026)
- Last-minute accommodation searches (within 28 days) climbed from 32% to 46% of all OTA searches between Q1 2023 and Q4 2025 (Hospitality Net/OTA data)
- Searches for getaways 181+ days away grew 30% quarter-over-quarter in late 2025, reflecting growing advance demand (OTA industry data)
- One-night hotel stays surged from 30% to 52% of US OTA searches over the same period (Hospitality Net)
- 72% of American travellers booked at least one vacation online in 2024, while 68% of searches now happen on mobile digital devices (Perk 2026)
- International inbound spending is expected to rebound 1.6% to $178 billion, still 18% below 2019 inflation-adjusted levels (U.S. Travel Association)
- The gap between the quietest and busiest months narrowed from 2.91 to 2.66 percentage points, with 65% of global markets seeing their peak months become less dominant (SiteMinder)
The 56-Day Rule: When Research Activity Actually Peaks
Across every vacation type Pilot Plans tracked in their 2026 report, pre-departure activity follows a remarkably consistent curve. It rises sharply between 90 and 180 days before departure, hits its apex at approximately 56 days out, then drops off a cliff inside the final two weeks.
That 56-day mark is not when people book. It is when they are most actively researching destinations, comparing hotels, and narrowing options. The actual reservation typically follows days or weeks later, which explains why SiteMinder's global average window of 32.15 days (30.57 days for US hotels specifically) sits well below the research peak.
We found a meaningful gap between research intent and booking action. Travellers evaluate an average of 25 hotel listings before committing, according to Criteo's 2026 summer travel analysis. That browsing-to-purchase gap is where 52% of potential guests abandon their reservation due to poor digital user experience. The implication is straightforward: the sweet spot for domestic flights sits between 34 and 86 days before departure according to a leading OTA's 2025 Air Hacks Report, while Google narrows the optimal window to around 39 days. Start researching at the 90-day mark, but secure your seats between day 56 and day 34 for the best combination of availability and price.
International travel operates on a longer timeline. For flights from the United States to Mexico or the Caribbean, 59 days is the price sweet spot, though reserving between 37 and 87 days out typically yields competitive fares. European destinations show the longest preparation duration of any category, with cultural tourism and luxury travel experiences driving earlier research activity that stays elevated deeper into the pre-departure window.
The Great Polarization: Advance Planners vs. Last-Minute Travellers
The most striking trend we identified across all 12 sources is not a simple shift toward earlier or later booking. It is a simultaneous pull in both directions.
On the advance side, OTA industry data showed that searches for destinations 181+ days away grew nearly 30% quarter-over-quarter in Q4 2025. EMEA travellers looking 91 to 180 days out surged 40% QoQ, while those searching beyond six months jumped 75%. The motivation is largely financial: 42% of travelers told Criteo they book earlier specifically to manage costs, and YouGov found that concern over future price increases drives 17% of those who secure accommodations more than six months ahead.
On the last-minute side, the shift is even more dramatic. US accommodation searches within a 28-day window climbed from 32% to 46% between Q1 2023 and Q4 2025. That is not a marginal increase. Nearly half of all American hotel searches now happen less than a month before check-in. Flight searches in the 0-to-6-day and 7-to-13-day windows both rose 10% according to OTA industry data.
Travel advisors confirm the split. In Travel Weekly's March 2026 survey, 38.1% said the 4-to-6-month window was the most common booking timeframe among their clients, while 25.4% pointed to 1-to-3 months and 25.8% reported 7-to-12 months. Multiple advisors specifically noted "shorter windows and more last-minute travellers" as a defining trend of 2026.
YouGov's nationally representative survey of 1,155 US adults puts concrete numbers on the split. For summer holidays, 46% secured flights and hotels one to three months before departure, while 26% made reservations less than a month out. For winter holidays, the distribution shifts forward: 47% plan to reserve one to three months ahead, 24% at four to six months, and 18% less than a month before departure. Just 12% lock in winter vacations more than six months in advance.
What is driving this polarization? The advance planners are motivated by cost anxiety and availability fears. The last-minute travellers are driven by schedule flexibility and a willingness to let family circumstances dictate their travel window. YouGov found that 18% of spontaneous travellers cited "family and friends' schedules" as the primary reason, followed by 14% who pointed to "date flexibility."
When Americans Go: The Shifting Seasonal Demand Curve
July remains the single busiest travel month in the United States, accounting for 31% of all planned summer vacations in 2026. Air passenger volumes will peak in the third week of July. That much has not changed. What has changed is everything around it.
The summer travel season is stretching in both directions. Post-Labor Day getaways increased from 12% of total summer activity in 2022 to 20% in 2026, according to a leading OTA's Unpack '26 report. More broadly, 77% of travellers now extend their summer into September, and 58% continue into October. The traditional Memorial Day-to-Labor Day window that once defined American summer is dissolving into a five-month season running from late May through October.
This is not just a consumer preference. The data shows a structural change in tourism demand. SiteMinder found that the gap between the quietest and busiest months narrowed from 2.91 to 2.66 percentage points across global markets. In 65% of those markets, peak months became less dominant. Shoulder-season occupancy in some US destinations now approaches historical peak-season performance.
Remote work is a significant enabler. Over 35% of US workers performed some or all of their duties remotely in recent years, and that figure has remained stable. Mid-week hotel stays are rising as a direct result, with Sunday-through-Thursday reservations increasing in local markets that were previously weekend-only destinations. The average length of stay is also extending outside traditional vacation periods, reflecting the blending of work and leisure experiences into longer, more flexible itineraries.
Meanwhile, 42% of travellers are actively choosing to explore destinations outside peak season, and 25% are seeking cooler places as climate concerns reshape what "summer" means. The old assumption that demand follows the school calendar is weakening steadily.
The One-Night Stay Surge and What It Signals
One of the most underreported patterns in our analysis is the explosive growth of one-night hotel stays. In the United States, single-night stays climbed from 30% of OTA and metasearch searches in Q1 2023 to 52% by Q4 2025. Globally, single-night OTA searches rose from 28% to 37%, but North America's shift was the most dramatic, moving from 31% to 56%.
At the same time, longer stays are declining. Searches for four-to-seven-night vacations fell by 10% in the US, and globally, eight-to-fourteen-day journeys dropped from 8% to 6% of all searches.
SiteMinder tells a similar story from the hospitality side: only 27% of all reservations worldwide were for two or more nights. The average value reflects this compression: OTA reservations average $312 compared to $516 for direct hotel website purchases, a gap partly explained by shorter stays on third-party platforms.
We see this as a fundamental restructuring. The one-night stay is not a truncated vacation. It is a different product entirely: a concert outing, a family visit, a workday in another city, a day excursion plus one night. The pattern aligns with the broader fragmentation: Americans are taking more getaways, but shorter ones, secured closer to departure. Tourism operators and hotel brands are already adapting their digital offerings to this reality.
The World Cup Effect: How a Single Event Reshapes National Demand
The 2026 FIFA World Cup, co-hosted by the United States, Mexico, and Canada from June 11 to July 19, is generating booking surges that dwarf normal seasonal patterns. OTA industry data tracked searches for the three host countries rising 35% collectively, with Mexico alone up 70%.
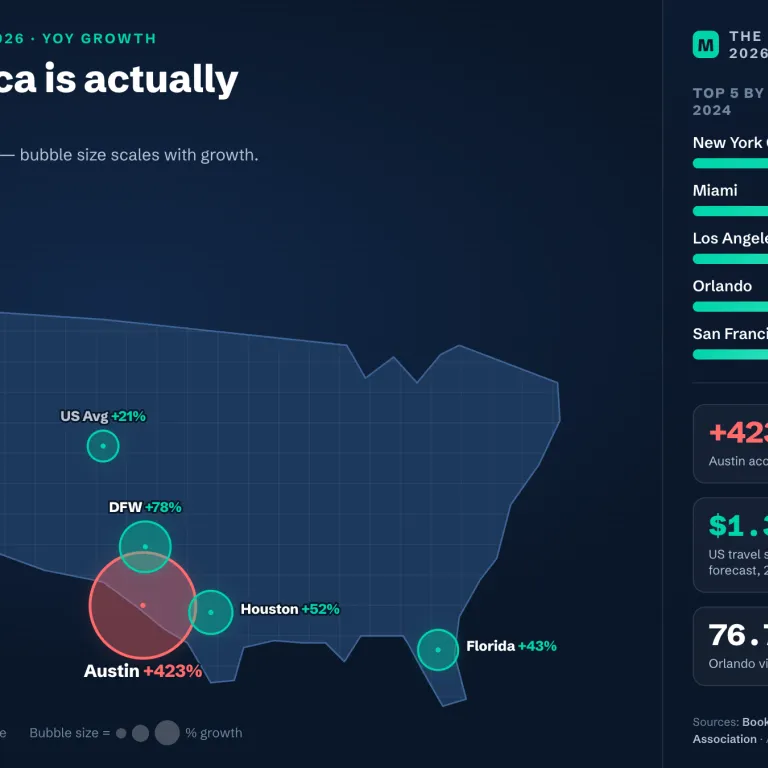
The host-city numbers are staggering. After the December 5, 2025 draw announcement, searches for Boston spiked 1,000% between December 5 and 8. Kansas City saw a sustained 260% increase. Monterrey, Mexico surged 330%. Dallas climbed 145%, Houston 80%, and Guadalajara 100%.
What makes this relevant to broader travel trends is the effect on reservation windows. Key Data Dashboard reported that FIFA host markets saw windows extending 60 to 120+ days in advance, far beyond the US average of 30.57 days. Event-driven travel creates its own demand curve, one where the window is defined by the announcement date rather than the traveler's usual cycle. For travellers heading to non-host cities during the tournament, this concentrated interest in select markets could create availability relief and price advantages elsewhere.
How AI Is Redrawing the Research Phase
The most forward-looking data point in our analysis comes from Criteo: 72% of their hospitality and tourism clients recorded reservations influenced by ChatGPT. Users arriving via ChatGPT showed 13 percentage points higher product-page landing rates than those arriving through traditional search.
More broadly, 51% of travellers now use digital AI tools during the research phase, and 41% use them specifically for hotel and accommodation searches. That is up 4 percentage points from the prior period. The breakdown tells us where the technology will reshape the industry: 40% use it to explore destinations, 41% for local experiences and activity selection, and 30% for complete itinerary assembly.
This does not mean AI is replacing traditional booking channels. What it means is that the research funnel is widening. Travellers who previously started on Google or an OTA now begin with a conversational query, receive a curated shortlist, and then move to familiar platforms to finalize. The 56-day research peak we identified earlier may increasingly begin with an AI conversation, but the purchase still happens on well-known digital platforms.
What the 2027 Travel Forecast Tells Us
The U.S. Travel Association projects spending growth to accelerate from 1% (inflation-adjusted) in 2026 to 3% in 2027 and 2028. International inbound travel, currently 18% below pre-pandemic levels after adjusting for inflation, is expected to recover as the post-World Cup momentum and eased visa processing take effect.
Several structural patterns in our data suggest where that growth will concentrate. Secondary and tertiary markets are capturing a growing share of reservations as interest diversifies geographically beyond traditional luxury and cultural hubs. SiteMinder found that US domestic share rose 3.22 percentage points to 77%, a tendency the World Cup may temporarily reverse before reasserting itself. The continued strengthening of shoulder seasons means growth will distribute more evenly across the calendar rather than stacking onto an already-saturated July peak.
For travellers, the practical takeaway is this: the 56-day rule still holds, but the window of opportunity is widening. Off-peak vacations are no longer a compromise. They are increasingly the smarter play, both for pricing and for the quality of local experiences, as destinations that were once sleepy in September now offer near-peak amenities with a fraction of the crowds.
FAQ
How far in advance should you book a US hotel in 2026?
Start researching around the 90-day mark and finalize between 56 and 34 days before your stay. The average US hotel reservation window is 30.57 days according to SiteMinder, but OTA industry data shows the best flight deals for domestic destinations fall between 34 and 86 days out. For international getaways from the United States, extend your timeline to 59 days for Mexico and the Caribbean, and three to five months for European destinations.
Are last-minute reservations increasing in the United States?
Significantly. US accommodation searches within a 28-day window climbed from 32% to 46% of all OTA searches between Q1 2023 and Q4 2025. Flight searches in the 0-to-13-day window rose 10% from the prior period. Nearly half of American hotel searches now happen less than a month before check-in, driven by schedule flexibility and the growing prevalence of one-night stays.
What is the busiest month for US vacations in 2026?
July accounts for 31% of planned summer activity, with air passenger volumes peaking in the third week of the month. However, the summer season is extending: post-Labor Day getaways rose from 12% to 20% between 2022 and 2026, and 77% of travellers now extend summer into September. The 2026 FIFA World Cup (June 11 to July 19) will amplify July interest in host cities.
How much do Americans spend on travel annually?
Total US spending is forecast to reach $1.37 trillion in 2026, with domestic activity accounting for $1.20 trillion (87% of the total). Domestic leisure spending alone hit a record $909 billion. International inbound spending is expected to reach $178 billion but remains 18% below 2019 levels when adjusted for inflation. Growth is projected to accelerate to 3% annually in 2027 and 2028.