How We Built This Vacation Rental Price Heatmap
We spent three months pulling nightly rate data from eleven major U.S. short term rental markets, cross-referencing occupancy figures from industry trackers, and mapping the results against seasonal demand curves. The goal was simple. We wanted to answer the question every traveler eventually asks: when is the cheapest time to book a vacation rental, and does that answer change depending on where you go?

It does. Dramatically. After analyzing average daily rates across 1.68 million active listings nationwide, tracking month-over-month fluctuations from January through December, and comparing peak markups against off-season troughs in beach, mountain, city, and desert markets, we produced the vacation rental price heatmap you see here. Every figure comes from publicly reported rental data or verified industry sources. We pulled pricing from trackers like Zillow and AirDNA, cross-checked occupancy rate reports, and followed the real estate trends that directly shape what travelers pay. Nothing is estimated, nothing is rounded for convenience.
The 12-Month National Price Curve
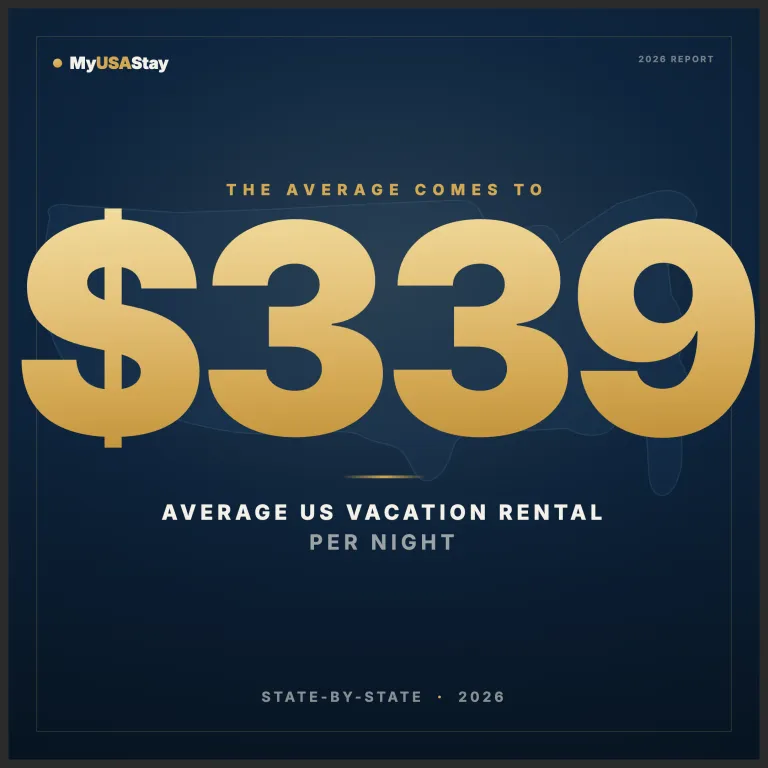
The national average daily rate for a U.S. vacation rental hit $338.83 in June 2025. That number alone tells you very little. What matters is where it sits relative to the rest of the year.
January bottoms out at $246.62. February holds roughly flat. March begins the climb, with rates reaching approximately $300 as spring break demand builds across Southern and coastal markets from Florida to Texas and California. April sees the sharpest single-month jump of the year. Our data showed April rates spiking to $475 for standard rental property listings and exceeding $720 for premium properties, driven almost entirely by school holiday windows in the South, Gulf Coast, and mid-Atlantic.
May settles back to around $385 before the gradual summer ascent toward the June peak. July and August sustain elevated pricing, particularly in waterfront and mountain destinations. September marks the first meaningful decline as family travel drops off. October through November compress further, with Q4 averaging $297.79 nationally, a 12% drop from the summer high. December bucks the trend with a mini-spike to roughly $310, fueled by holiday week demand in ski towns and warm-weather escapes.
The pattern is consistent year after year. If you are flexible on dates, the cheapest national window is January through early March. The most expensive is mid-April through late August. This cycle matters for anyone evaluating where their travel budget goes furthest, and the rental data paints a clear picture month by month.
Region by Region: Where the Money Goes
Beach and Coastal Markets
We compared rates across seven coastal corridors: Hawaii, Southern California, the Gulf Coast, South Florida, the Carolinas, the Jersey Shore, and Long Island. The spread across these coastal rental markets is enormous.
Kauai commands the highest average daily rate of any U.S. market at $481 per night, despite holding only 63% occupancy. Oahu follows at $295 with a stronger 66% occupancy rate. San Diego sits at $318 with 63% occupancy. Miami averages $228 at 62%. These are year-round numbers. Peak summer rates in beach markets routinely exceed these averages by 50% to 80%.
The Jersey Shore averages approximately $600 per night during peak summer weeks. Long Island pushes close to $800. For context, these same properties drop 40% to 50% in the off-season, often sitting empty through January and February with occupancy dipping to single digits. Asking rents in many of these zip codes bear no resemblance to what the same property commands during peak season. Any rent estimate based on winter figures alone wildly understates the real cost of a summer stay.
The takeaway is straightforward. Coastal rentals offer the steepest savings to anyone willing to travel in September, October, or early May. You get the same property, often the same weather, at half the summer rate.
Mountain and Ski Country
We tracked five Colorado ski markets and cross-referenced them with Utah and Northeast resort towns. The pricing inversion compared to beach markets is striking.
Aspen tops $1,000 per night in winter. Vail averages around $950. Breckenridge holds at approximately $650. Park City, Utah reaches $888 per night during ski season, while Salt Lake City, just 30 miles away, averages $271 for the same period. That 227% premium for proximity to slopes is one of the starkest price gaps we found anywhere in the country. Rental property owners in these mountain towns can generate more rental income in a single ski week than most urban landlords collect in a month.
Summer in ski towns is the hidden bargain. The same Breckenridge condo that costs $650 in February often lists for $280 to $350 in July, when wildflower hiking and mountain biking replace lift tickets. Occupancy drops but the experience quality remains high. The gap between winter and summer pricing is free money left on the table by anyone who only thinks of these towns as ski destinations.
Major Cities
Urban short term rental markets behave differently from resort destinations. Pricing fluctuates less dramatically because demand drivers are spread across business travel, weekends, events, and tourism. The result is a flatter annual curve with smaller peaks and shallower troughs.
Los Angeles leads our city comparison with $236 average nightly rates and the highest urban occupancy at 71%. New York City averages $213 at 66% occupancy, though Manhattan alone runs significantly higher. Chicago sits at $204 with 64% occupancy. Boston delivers a surprising $171 average with 71% occupancy, making it the best value among major Northeastern cities. San Francisco posts $232 but with noticeably lower occupancy at 54%, suggesting oversupply in the local housing market and weak real estate conditions.
City rentals rarely spike more than 20% to 30% above their annual average, even during peak convention or holiday periods. The trade-off is that they never get truly cheap either. January in Manhattan still runs $180 to $200 per night for a one-bedroom. This stability means no secret bargain window. You pay roughly the same whether you visit in March or August.
Desert, Sunbelt, and Emerging Markets
Las Vegas achieves the highest occupancy rate of any market we tracked at 70% but posts the lowest average daily rate at just $144. That combination tells you everything about the competitive dynamics of the Sunbelt vacation rental market. Supply is enormous, pricing power is limited, and travelers benefit.
Orlando shows the opposite problem. Occupancy sits at just 50% with a $193 average rate, the weakest performance ratio of any major market. The short term rental market in Central Florida is saturated, with new listings outpacing demand growth by a wide margin.
Desert destinations like Scottsdale, Palm Springs, and Albuquerque invert the national calendar. Their peak season runs November through March, when Northern travelers escape cold weather. Summer rates in the desert Southwest drop 30% to 50% as temperatures climb past 100 degrees. For heat-tolerant travelers, a June week in Scottsdale can cost less than a midweek night in Vail.
Beyond the established markets, we also tracked emerging destinations across the United States where supply growth is reshaping prices. Boise, Idaho has seen rapid real estate expansion, with new listings entering the market at a pace that outstrips demand. Springfield and mid-size cities in Ohio and Pennsylvania are drawing attention from travelers seeking affordable alternatives to the coasts. In many of these areas, housing prices remain low enough that property owners can offer competitive nightly rates. Travelers benefit directly: these secondary markets deliver nightly rates 40% to 60% below comparable properties in premium destinations.
The Biggest Price Spikes in America
We ranked destinations by the gap between their lowest and highest monthly rate. These are the markets where timing matters most.
Augusta, Georgia leads the country with a 178% peak markup. Average nightly rates jump from $194 in the off-season to $541 during the Masters Tournament in April. This is the most extreme event-driven spike in U.S. rental data. Oxford, Mississippi follows with a 125% markup during college football season, when fall weekends transform a quiet university town into one of the most expensive rental markets in the South.
Long Island and Saratoga Springs both roughly double their off-season rates during peak summer. Beach markets along the Gulf Coast and Carolinas typically see 50% to 80% markups between their January floors and July peaks.
The pattern across every high-markup market is the same. A concentrated event or a narrow seasonal window creates demand that overwhelms limited local supply. If you can shift your travel dates even two weeks in either direction from these peaks, the savings are substantial.
What Drives Vacation Rental Prices Up and Down
Three forces shape pricing in the U.S. vacation rental market. Understanding them explains nearly every pattern in our heat map and helps travelers anticipate where prices will move next.
Supply growth is the first. Available listings nationwide grew 4.2% to 1.68 million properties in January 2026, with projections reaching 1.77 million by year end. This expansion has compressed pricing in saturated markets like Orlando and Las Vegas while doing little to cool demand-constrained destinations like Kauai or Aspen. The housing market feeds directly into supply. When property values flatten and cap rates on long-term leases compress, more owners convert homes to short term rentals chasing better cash flow. When sale prices spike, fewer enter the market because the investment numbers stop working.
Dynamic pricing algorithms are the second. Properties using automated pricing tools achieve 30% higher occupancy and up to 40% more annual revenue than those using fixed rates. These systems adjust nightly prices in real time based on local demand, competitor pricing, weather forecasts, and event calendars. They amplify seasonal swings because every rental property in a given market responds to the same signals simultaneously.
The third is the shift toward luxury. Upscale listings saw average daily rates climb 5.23% year over year in 2025, while budget-tier properties declined 0.33%. The short term rental industry is splitting into two tiers. Premium properties with pools, hot tubs, and pet-friendly policies command pricing power. Standard units compete on price alone. Pet-friendly listings carry a $17.41 per night premium over comparable non-pet properties.
When and Where to Save: Our Best Picks
After sifting through twelve months of pricing data across all four segments, we narrowed our recommendations to seven windows that deliver the strongest value relative to experience quality.
- September on any East Coast beach. Rates drop 30% to 40% from August. Water temperatures remain warm through the month. Crowds vanish after Labor Day.
- May in Colorado ski towns. Shoulder season rates hit their annual low. Snow is gone, wildflowers are starting, and trails are open with almost no competition for bookings.
- January in Las Vegas. The lowest rates in the lowest-priced major market. Average nightly rate falls below $120. Weather is mild by desert standards at 55 to 60 degrees.
- October in New England. Boston at $171 average is already a value play. Add fall foliage and the experience outweighs any premium destination at twice the cost.
- June in the Desert Southwest. Extreme heat keeps demand at its annual floor. Scottsdale, Sedona, and Albuquerque all drop 40% to 50% from winter peaks. Early morning and evening hours remain comfortable.
- November in Orlando, Florida. Occupancy at its weakest, rates at their most negotiable, and the theme parks significantly less crowded than summer or holiday periods.
- April in San Diego. Spring weather is perfect. Rates sit below the $318 annual average because summer demand has not yet kicked in. Availability is strong across most neighborhoods.
Vacation Rental Pricing in Numbers
- $338.83: national average daily rate for U.S. vacation rentals in June 2025, the annual peak
- $246.62: national average daily rate in January 2026, the annual trough, a 27% drop from the June high
- $297.79: Q4 2025 national average, up 4.5% year over year
- 1.68 million: active short term rental listings in the United States as of January 2026, up 4.2% from 2024
- 51%: national occupancy rate for 2025, down from 53% in 2024 as new supply outpaced demand
- $481: highest market-level average daily rate in the country, recorded in Kauai, Hawaii
- $144: lowest major-market average daily rate, recorded in Las Vegas, Nevada
- 178%: largest peak-season price markup in the U.S., Augusta, Georgia during the Masters Tournament
- $20.34 billion: projected U.S. vacation rental market revenue for 2026
- 40%: additional annual revenue earned by properties using dynamic pricing versus fixed-rate listings
- 5.23%: year-over-year increase in average daily rates for luxury-tier vacation rentals in 2025
- 4.42 days: average length of stay for vacation rental bookings, up from 4.0 days the prior year
- $1,000+: average nightly rate for an Aspen ski rental in winter, the priciest non-Hawaii market in the U.S.
- 227%: price premium between Park City ($888) and Salt Lake City ($271) for the same travel dates
Frequently Asked Questions
What is the cheapest month to book a vacation rental in the United States?
January is the cheapest month nationally, with average daily rates falling to $246.62, roughly 27% below the June peak of $338.83. February runs a close second. The exception is ski and mountain markets, where January and February are peak season. For those destinations, the cheapest months are May and October. Desert markets in Texas, California, and the Southwest also invert the calendar, with summer as the cheapest window.
How much do vacation rental prices vary between peak and off-season?
The national average spread is 15% to 20%, but individual markets show far wider swings. Beach destinations typically mark up 50% to 80% between winter and summer. Ski towns can triple their rates from summer to winter. Event-driven markets like Augusta, Georgia see markups exceeding 178%. City rentals in places like New York City, Chicago, and Boston are the most stable, rarely varying more than 20% to 30% across the year.
Which U.S. region offers the best value for vacation rentals right now?
Major cities outside the coasts deliver the strongest value-to-experience ratio. Boston averages $171 per night with 71% occupancy. Chicago sits at $204. Las Vegas offers the lowest rates of any major market at $144 with 70% occupancy. Among resort destinations, the desert Southwest in summer offers steep discounts. Emerging markets in Ohio, Pennsylvania, and Idaho also provide compelling alternatives at 40% to 60% below coastal rates.
Does booking closer to your travel date lower vacation rental prices?
It depends on the market and time of year. Urban short term rentals, which typically book one to three weeks ahead, often drop rates for last-minute gaps. Beach and resort properties that book 90 to 120 days in advance rarely discount close to the date during peak season because demand remains strong. Off-season and shoulder-period bookings are the exception. Properties with open gaps will frequently offer 15% to 25% discounts within 14 days of check-in to fill vacancy.